
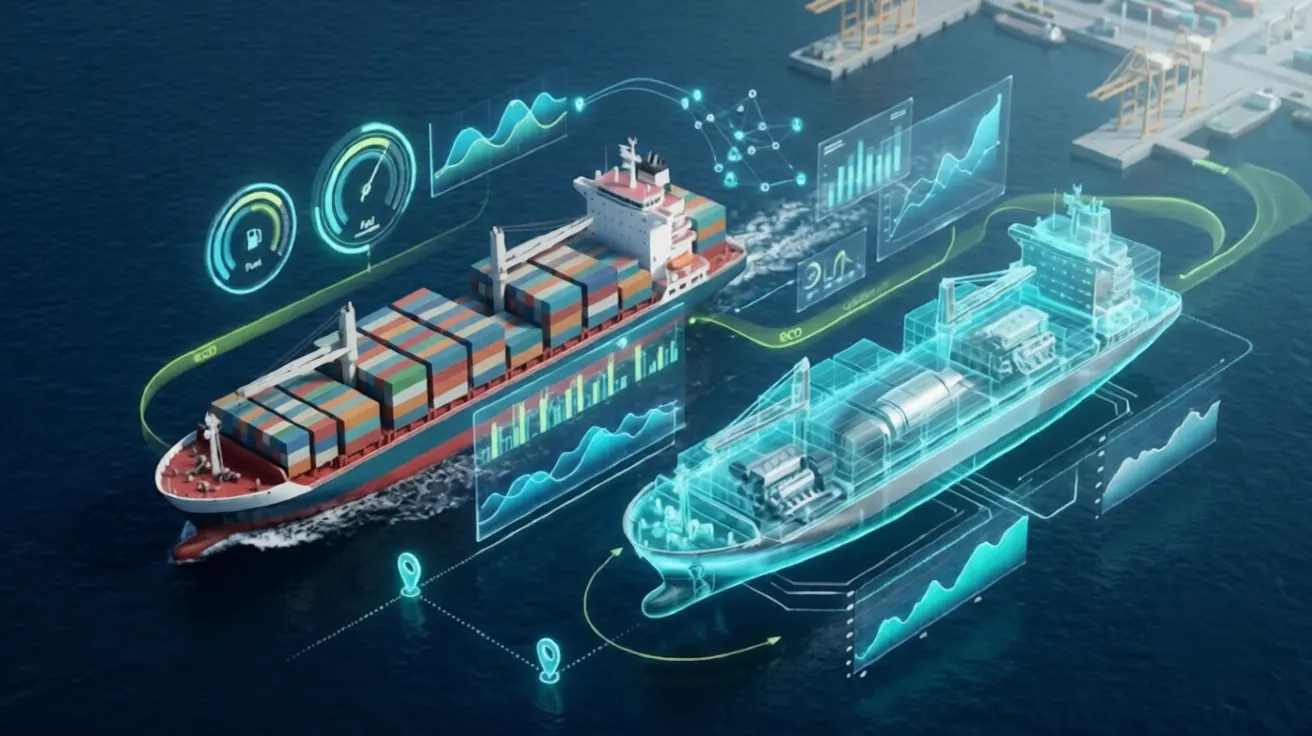
Running a vessel involves more than tracking its location and arrival time. Ship operators must also monitor fuel use, engine performance, speed, maintenance needs and operating costs. Without clear data, it can be difficult to understand why one vessel performs better than another.
This is where data analytics can help. A Maritime Software Company in Mumbai can help shipping businesses organise vessel data, create performance dashboards and identify patterns that support better operational decisions.
For ship operators in Mumbai, where shipping companies, ship managers and maritime service providers work across different locations, having access to reliable performance information can make daily operations easier to manage.
Why Vessel Performance Monitoring Matters
Vessel performance refers to how well a ship operates based on factors such as fuel consumption, speed, engine condition, maintenance and voyage efficiency.
A vessel may complete its voyages on time but still use more fuel than expected. Another vessel may have frequent maintenance issues that increase operating costs.
Looking only at the final voyage result does not show the full picture.
Understanding daily vessel operations
Ship operators receive information from several sources, including:
- Daily vessel reports.
- Engine and machinery records.
- Fuel consumption reports.
- Voyage logs.
- Maintenance records.
- Weather and sea condition reports.
- Speed and distance records.
When these records are stored separately, comparing vessel performance becomes difficult.
Data analytics brings relevant information together so operators can review performance from one place.
Making better operational decisions
A clear view of vessel performance helps operators answer important questions:
- Is the vessel using more fuel than expected?
- Are engine performance levels changing?
- Which voyages have higher operating costs?
- Are maintenance issues becoming more frequent?
- Is the vessel maintaining its expected speed?
- Which operational changes need attention?
These answers help teams move from guesswork to data-based decisions.
7 Ways Data Analytics Helps Evaluate Vessel Performance
1. Monitor Fuel Consumption
Fuel is a major operating expense for shipping companies. Even small changes in fuel use can affect voyage costs.
Data analytics helps operators compare fuel consumption across voyages, vessels and operating conditions.
For example, a dashboard can display:
- Daily fuel consumption.
- Fuel used during a voyage.
- Consumption by fuel type.
- Fuel use at different speeds.
- Historical fuel consumption trends.
Operators can compare actual consumption with suitable reference values and investigate unusual changes.
Suppose a vessel uses more fuel than its normal operating pattern on several voyages.
The operator can review factors such as vessel speed, weather, cargo load, engine condition and route conditions to understand the possible reason.
The data does not automatically prove the cause. It helps the team identify where further investigation is needed.
2. Track Engine and Machinery Performance
Engine performance plays a major role in vessel reliability.
Changes in temperature, pressure, vibration or other machinery readings may indicate that equipment needs attention.
A performance monitoring dashboard can bring these readings together.
Operators can review:
- Main engine operating hours.
- Engine temperature.
- Lubrication oil pressure.
- Machinery alarms.
- Auxiliary engine performance.
- Equipment maintenance history.
When connected to suitable monitoring systems, the platform can also display readings from onboard sensors.
Comparing current readings with historical records can help teams notice unusual patterns.
For example, a repeated rise in engine temperature may require a technical inspection. The dashboard can help the engineering team review when the change started and whether it has continued.
3. Compare Voyage Performance
Not every voyage has the same operating conditions.
Distance, weather, cargo weight, speed and route conditions can affect voyage performance.
Data analytics helps ship operators compare voyages using relevant information.
A voyage performance can show:
Ship operators can evaluate vessel performance by monitoring the distance travelled to understand voyage progress. Average speed helps assess speed consistency, while fuel consumption provides insights into how efficiently fuel is being used.
Voyage duration shows the total time taken to complete a journey. Weather conditions help identify external factors that may affect vessel operations, and port waiting time highlights delays experienced while waiting at ports. Together, these factors provide a clearer picture of overall vessel performance and operational efficiency.
These comparisons help operators understand differences between voyages.
For example, if two similar voyages have different fuel consumption, the team can review speed, weather and engine records before deciding whether operational changes are needed.
4. Improve Maintenance Planning
Unexpected equipment failures can affect vessel schedules and increase repair costs.
Data analytics can help operators review maintenance history and identify repeated problems.
A central dashboard can display:
- Upcoming maintenance activities.
- Completed maintenance tasks.
- Equipment repair history.
- Repeated machinery faults.
- Pending inspections.
- Equipment operating hours.
This information can help technical teams plan inspections and maintenance work.
Predictive maintenance uses equipment data and historical patterns to estimate when maintenance may be needed.
For example, if machinery readings show a repeated change over time, an analytics system may flag the equipment for inspection.
However, predictions depend on reliable data and suitable models. They should support, not replace, engineering judgement and approved maintenance procedures.
5. Evaluate Vessel Operating Costs
Vessel performance is not only about speed and fuel.
Operators also need to understand how daily operations affect overall costs.
A data analytics platform can bring together relevant financial and operational records.
These may include:
- Fuel expenses.
- Repair and maintenance costs.
- Spare parts purchases.
- Port-related expenses.
- Lubricant costs.
- Other voyage expenses.
Operators can compare costs across vessels and reporting periods.
For example, if maintenance costs for one vessel increase over several months, the team can review repair records and equipment history to identify areas that need attention.
6. Monitor Environmental Performance
Environmental performance is an important part of modern ship operations.
Fuel consumption data can help operators understand energy use and monitor emissions-related indicators.
The International Maritime Organization (IMO) requires ships of 5,000 gross tonnage and above to collect and report fuel oil consumption data under its Data Collection System (DCS). Since 2023, this data has also been used to calculate a ship's operational Carbon Intensity Indicator (CII).
International Maritime Organization+1
Analytics can help operators organise relevant information, review trends and prepare for performance assessments.
A monitoring system may include:
- Fuel consumption by type.
- Distance travelled.
- Operating hours.
- Carbon intensity indicators.
- Historical energy performance.
- Relevant reporting records.
The IMO's guidance on ship energy efficiency provides further information on managing and improving ship efficiency.
7. Create Fleet Performance Dashboards
Ship operators may manage several vessels at the same time.
Reviewing individual reports can take a lot of time. A fleet performance dashboard can bring key information into one view.
For example, it can show:
- Vessel-wise fuel consumption.
- Average voyage speed.
- Maintenance status.
- Operating costs.
- Pending technical issues.
- Performance trends.
- Environmental indicators.
Managers can compare vessels and identify which areas need further attention.
The dashboard can also support regular performance meetings between shore-based teams and vessel staff.
Important Data Analytics Metrics for Ship Operators
A useful analytics system should focus on metrics that support real operational decisions.
Ship operators can monitor daily fuel consumption to understand how much fuel a vessel uses each day. Fuel consumption per nautical mile helps compare fuel efficiency against the distance travelled, while average vessel speed provides insights into voyage performance.
Main engine operating hours help track engine usage and identify how intensively the machinery is being used. Maintenance frequency can reveal recurring equipment issues, while voyage duration helps evaluate how long vessels take to complete their journeys.
Port turnaround time measures the time spent during port calls, helping identify operational delays. Operating cost per voyage provides a clear view of total voyage expenses, and carbon intensity helps assess the vessel's environmental performance. Together, these metrics help ship operators make informed decisions about fuel efficiency, maintenance, costs and overall fleet performance.
These metrics should be compared under suitable conditions. For example, fuel consumption alone may not provide a fair comparison between vessels of different sizes or voyages with different cargo loads.
How Ship Operators Can Start Using Data Analytics
Businesses do not need to build a complex analytics system from the beginning.
A gradual approach can make implementation easier.
Step 1: Identify the main questions.
Decide what the team wants to understand first. This could be fuel consumption, maintenance costs or voyage performance.
Step 2: Collect existing vessel data.
Review daily reports, fuel records, maintenance logs and voyage information.
Step 3: Organise the information.
Use consistent vessel identifiers, dates, measurement units and reporting formats.
Step 4: Create performance dashboards.
Start with a few important metrics and make the information easy to understand.
Step 5: Review trends regularly.
Compare current performance with historical records and investigate unusual changes.
Step 6: Improve the system over time.
Add more data sources, automated reporting and advanced analytics when the basic system is working well.
What to Check Before Choosing Analytics Software
Before adopting a solution, ship operators should consider:
- Whether it supports the required vessel data.
- Whether it can connect with existing systems.
- Whether reports can be customised.
- Whether users can access information securely.
- Whether it supports multiple vessels.
- Whether data can be exported for reporting.
- Whether the system can grow with business needs.
A suitable Shipping Software Company in Mumbai can help businesses assess these needs and plan a system around their existing workflows.
The Growing Role of Digital Analytics in Mumbai's Maritime Sector
Mumbai is an important centre for India's maritime administration and shipping businesses.
Digitalisation is also becoming more important in maritime operations.
For example, the Directorate General of Shipping describes its Command and Control Centre initiative in Mumbai as a system designed to use real-time monitoring, data analytics and business intelligence for maritime decision-making. Its planned data integration includes vessel traffic, AIS, weather tracking and geospatial information.
DGMA
Similarly, Jawaharlal Nehru Port Authority has introduced a Harbour Management System that integrates vessel scheduling, pilotage data, resource allocation, safety monitoring and sustainability tracking.
Press Information Bureau+1
These developments show the growing role of connected data in maritime operations.
For individual ship operators, the same principle can be applied at the vessel and fleet level. A well-planned analytics system can connect operational records and help teams understand performance more clearly.
How Unovative Can Help
Ship operators need software that fits their vessels, reporting methods and business processes.
Unovative is an IT and AI software company based in Palghar, Maharashtra, with an international presence in Vietnam. Its areas of work include custom software development, enterprise applications, automation and digital transformation.
For maritime businesses in Mumbai, Unovative can help explore solutions such as:
- Vessel performance dashboards: Bring fuel, voyage and maintenance information into a central view.
- Custom analytics applications: Organise data from different sources for easier performance reviews.
- Automated reporting: Reduce repetitive work involved in collecting and preparing operational reports.
- Enterprise software integration: Connect suitable business systems and reduce separate data records.
- AI-powered analytics: Explore pattern detection and predictive insights where suitable data is available.
A Marine Software Development Company in Mumbai's wider business ecosystem can help ship operators plan digital tools around their actual operational needs.
Explore Unovative's website to learn more about its software and digital product development capabilities.
Data analytics is not only for large shipping companies. Ship operators can start with the vessel data they already collect, a few key performance metrics and a simple dashboard. The key is to track fuel use, voyage performance and maintenance records, then review the results regularly.
Start with fuel consumption. Then add engine monitoring, maintenance and fleet performance once your team trusts the data.
Want help building a vessel performance dashboard? Contact Unovative to discuss your maritime software requirements and the insights you want to gain from your vessel data.